Margins
Margins shows what you keep after cost, shop-wide and per product, measured from the orders you really fulfilled at what the stock really cost. It holds that against a target you set, then ranks which prices to fix by the dollars each recovers per month. Setting the price stays in Shopify; Atlessa tells you which price and what it is worth.
- Margin (or contribution margin): revenue minus cost, per product and shop-wide, from fulfilled orders at real cost.
- Realized margin: measured from orders you actually shipped, net of refunds, not from list prices.
- Unit cost here is your WAC (weighted average cost), the stock average from How batches and lots work, shown per product in Products and variants and Cash in stock.
- Target margin: the percentage you aim for (40% here). The floor beneath it (20% here) marks a margin you should not sell under.
- Ranked actions: repricing suggestions ordered by dollars per month recovered.
- Quadrants (Protect, Grow, Fix, Cut): classify each selling product by margin and volume together.
- Margin bridge: what moved your blended margin rate between periods, split into cost, price, and mix.
- Reprice in Shopify: a deep link out to the product, because Shopify owns the price.
Steps
- Open Margins. Go to Reports, then the Margins tab.
Margins sits under Reports with Exports and Cash in stock. It opens on your realized margin for the period: revenue minus cost across fulfilled orders, valued at WAC, against your target (computation below). Subtext names the basis (Last 90 days, 13 fulfilled orders, 18 products); a period control (7d, Month, 90d, Year) and a Target control (40%) sit to the right. The banner says it in one line: 53% margin over 90 days, 2 of 18 products dragging it, repricing the ones below recovers about $76.94/month. That is where you stand, what holds you back, and what fixing it is worth.
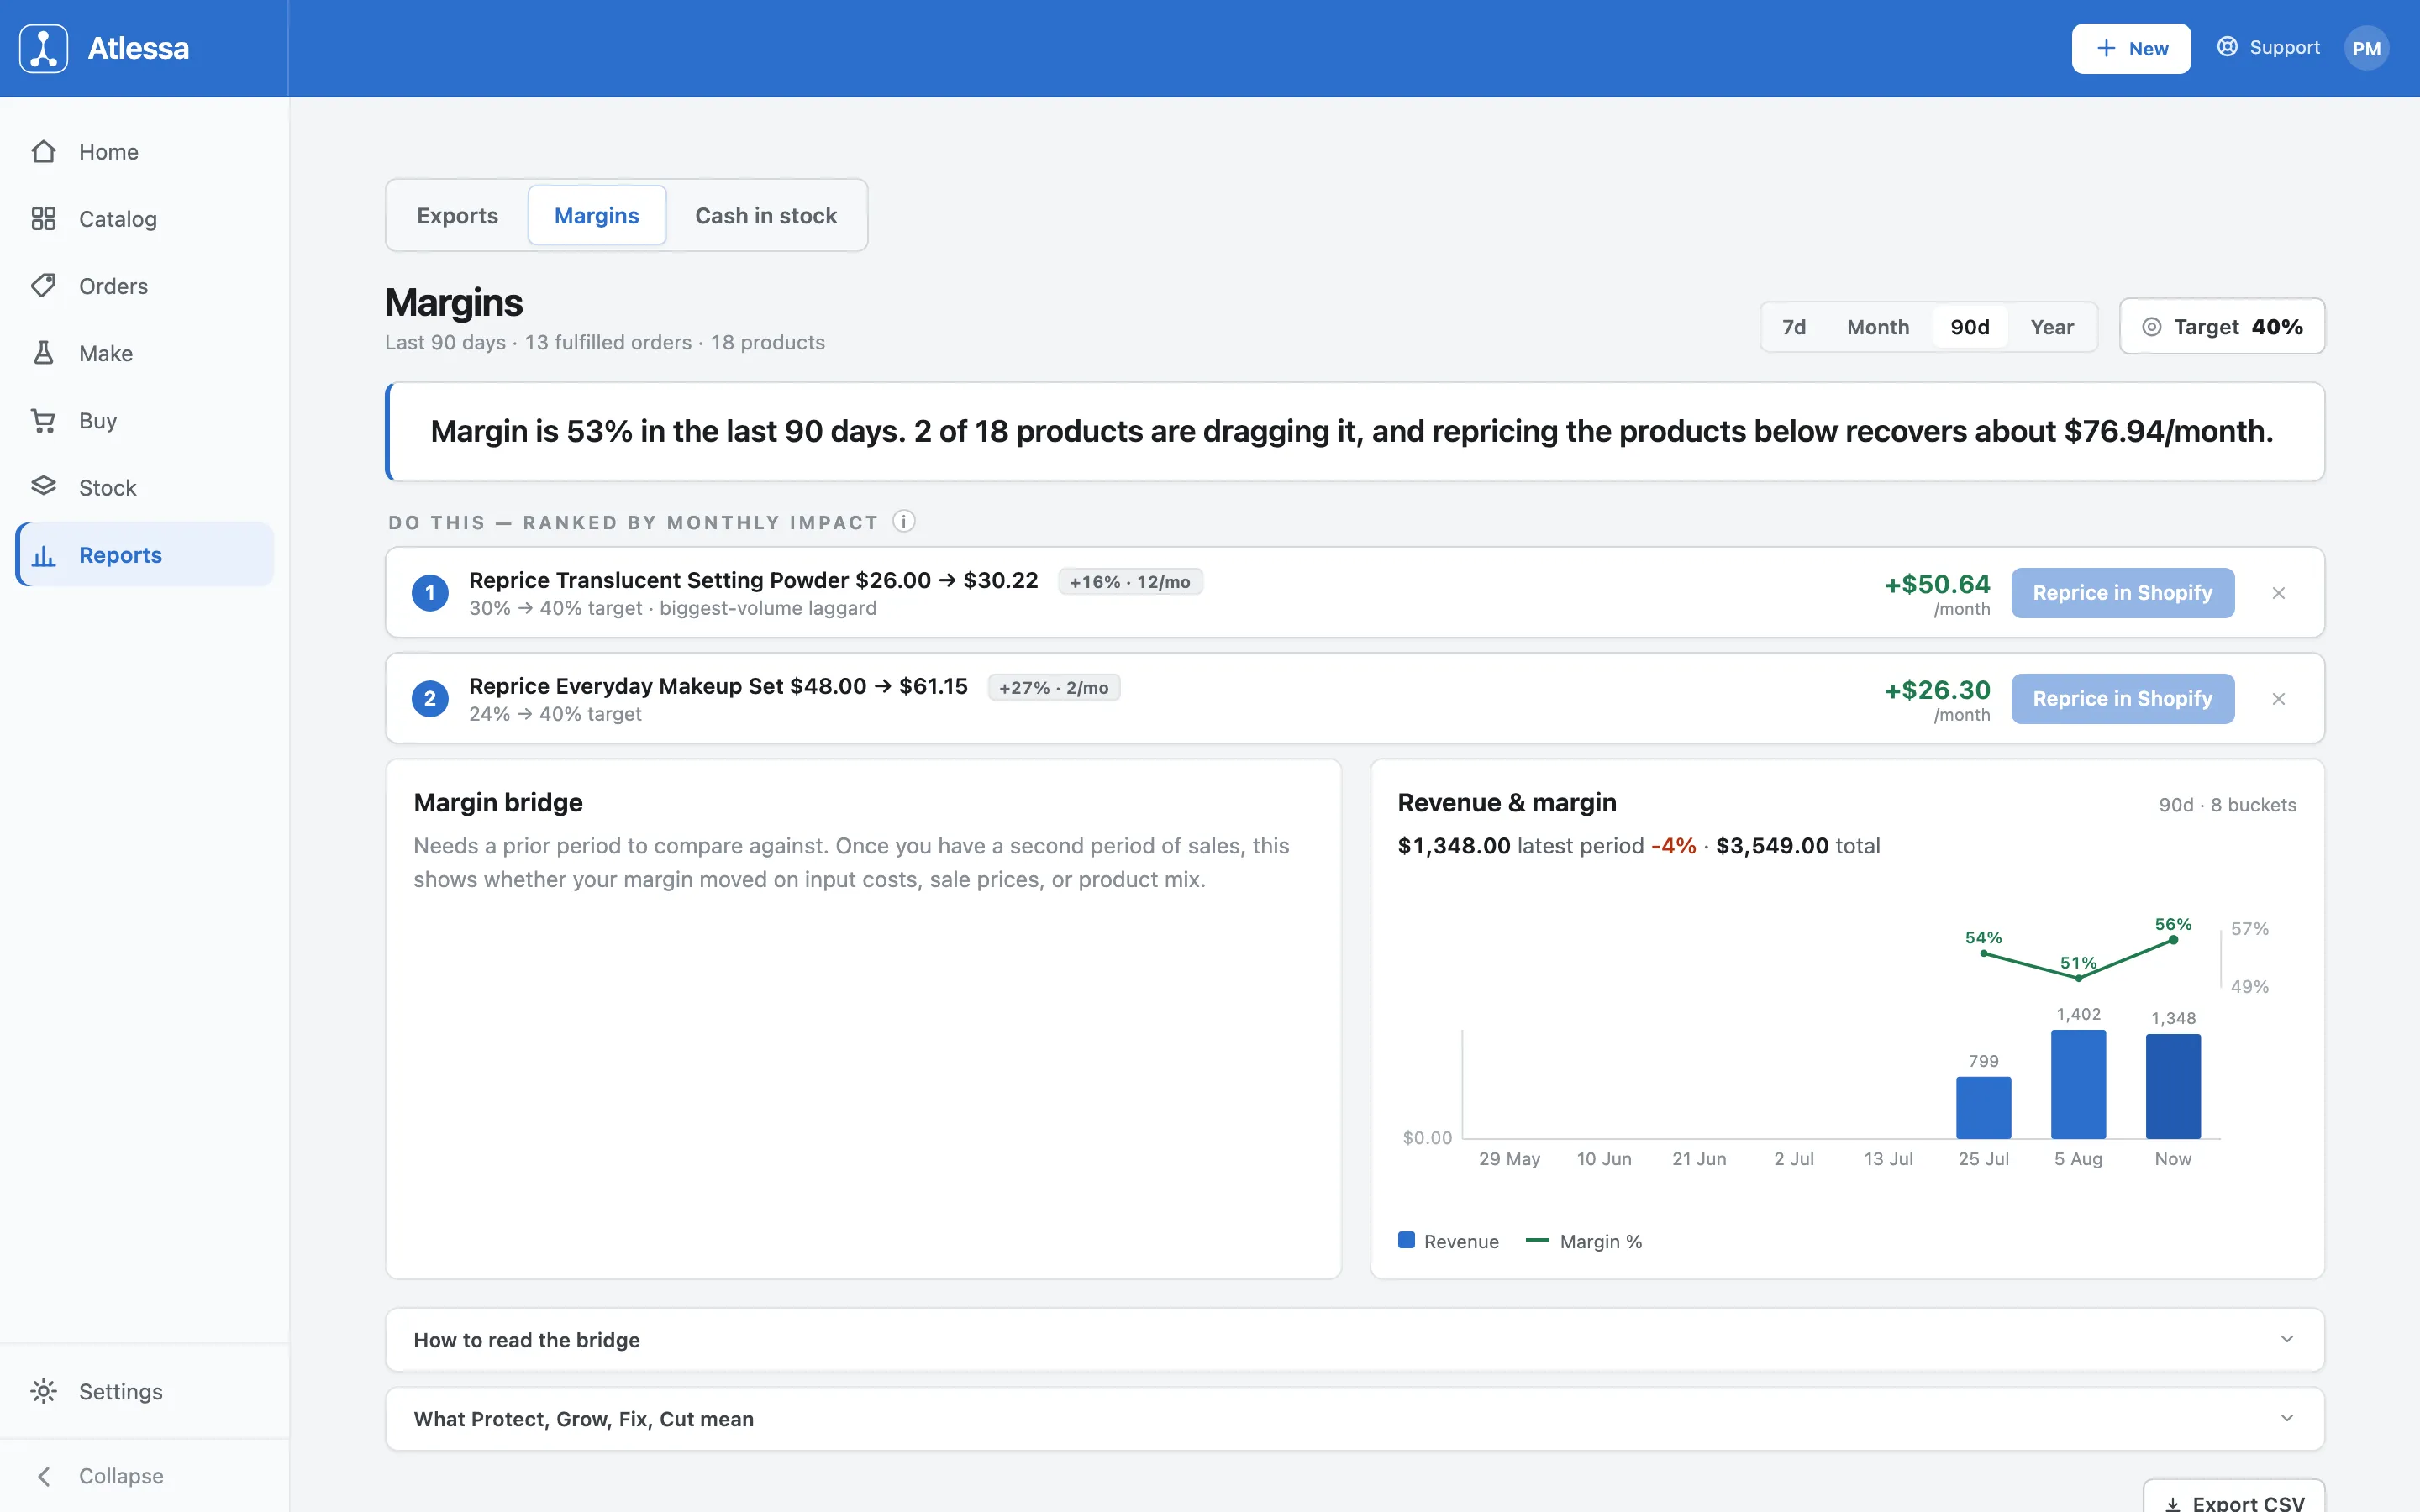
The Margins overview: 53% realized margin over 90 days against a 40% target, the banner naming what is dragging it, and the ranked reprice list below. - Work the ranked repricing list.
The Do this list ranks products below target by the dollars per month each fix recovers, not by how far off they are (formula below).
- #1: Translucent Setting Powder, $26.00 to $30.22 (+16%, 12/month, 30% to 40% target, biggest-volume laggard), worth +$50.64/month.
- #2: Everyday Makeup Set, $48.00 to $61.15 (+27%, 2/month, 24% to 40% target), worth +$26.30/month.
The banner total is these impacts summed. Each row has a Reprice in Shopify button: Atlessa suggests the price and impact, and it deep-links to the product in Shopify, where the price is set.
Do this, ranked by monthly impact: each laggard named with its suggested new price, the dollars per month it recovers, and a Reprice in Shopify deep link. - Read the trend and the bridge.
The Revenue & margin chart tracks both over the period, one bucket at a time (90d, 8 buckets). Revenue is the bars, margin percent the line: $1,348.00 latest (down 4%), $3,549.00 total, the line in the low-to-mid fifties. Beside it, the Margin bridge splits the change in your blended margin rate into cost, price, and mix bars, so you see not just that the rate moved but why (bars, and why no volume bar, below). It needs a prior period, so it stays blank until you have a second period of sales.
The Revenue and margin chart over the period, and the Margin bridge waiting on a prior period before it can show what moved your margin. - Go product by product.
The full table, Contribution margin, realized, fulfilled orders, lists every product with units, average price, unit cost (WAC), revenue, margin, margin percent, a vs prior column, and a Quadrant sorting each selling product into Protect, Grow, Fix, or Cut by margin and volume (splits below).
- Silk Foundation Shade 110 (FND-110, 12 units, $34.00 avg, $13.90 cost, $408.00 revenue, $241.20 margin, 59%) is PROTECT, as are Rose Lip Tint (61%), Soft Blush Petal (52%), Amber & Vanilla Candle (50%).
- Champagne Highlighter (52%) and Candelilla Body Balm (65%) are GROW: healthy margin, low volume.
Bucket tabs split the list (Needs attention 2, Protect 8, Grow 7, Fix 1, Cut 1, All 18); a note reads Top 6 products = 54% of your margin this period; and you can search, filter, and Export CSV. Two helpers, How to read the bridge and What Protect, Grow, Fix, Cut mean, expand for the definitions.
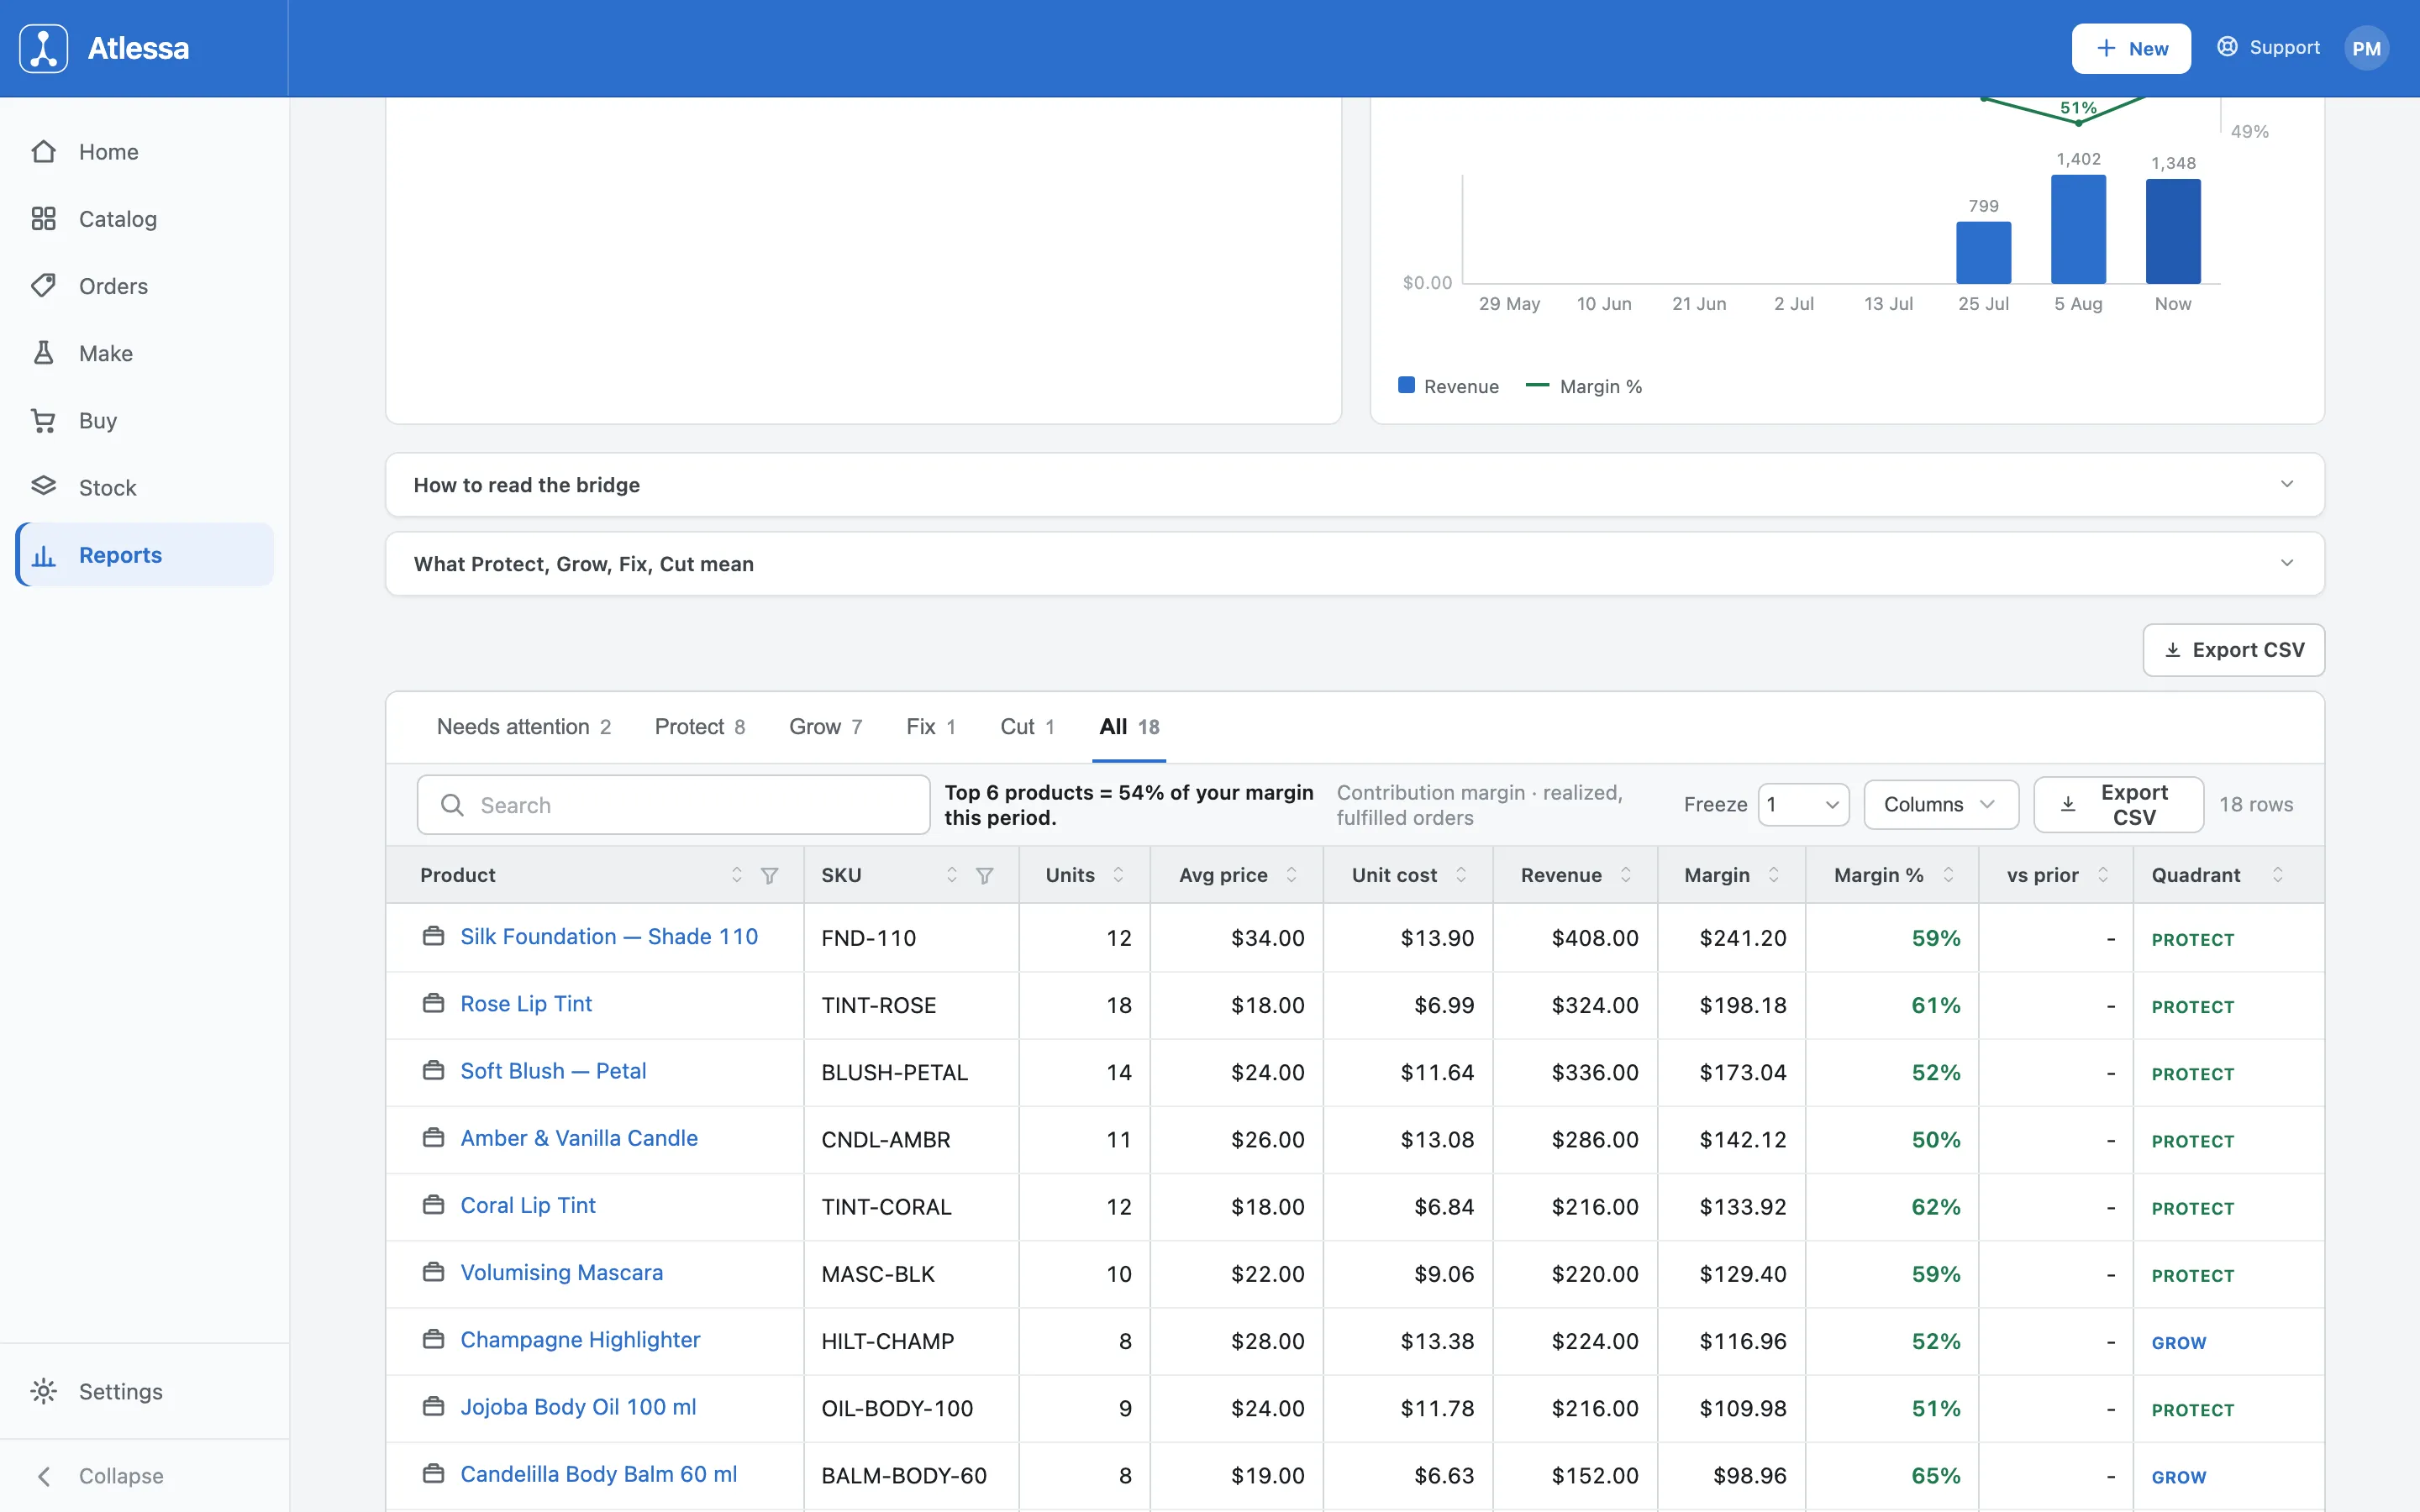
The product table: every product with units, average price, WAC unit cost, revenue, and margin, each classified into a Protect, Grow, Fix, or Cut quadrant, filterable and exportable.
How the numbers are worked out
Realized, at WAC, to the variant. Every figure comes from orders fulfilled in the period, not list prices or theoretical costs. Per sold line, margin is the sale price you captured minus the WAC cost of the units shipped; a refunded line is dropped whole. Survivors group to the variant (the sellable SKU), so units, revenue, and cost sum per variant and across the shop. WAC is the weighted average cost of your stock, the same average in How batches and lots work and carried per product in Products and variants and Cash in stock. This never hides products: the table always lists your full catalog, and realized sales drive the figures, not whether a row appears (zero-sale case under Common questions).
Target and floor. The shop sets a target (40% default) and a floor beneath it (20% default).
- The target is what the whole report measures against: it decides Do this, it is what the suggestions solve for, and it is the top-or-bottom split in the quadrants.
- The floor marks the level you should not sell under, separating a product you can reprice from one you must rethink.
- Set all three on the Target control: target percent, floor percent (below target), and the volume threshold that splits the quadrant columns (blank derives it from the median).
Changing the target moves the suggestions and their figures with it.
The quadrants. Only variants that actually sold (units and revenue above zero) get one. Each lands in one box from two independent splits: margin vs target sets the row (at or above target is high), units vs the volume threshold set the column (at or above is high).
- Protect (high, high): your engine, defend it.
- Grow (high margin, low volume): healthy but small, sell more.
- Fix (low margin, high volume): plenty of sales bleeding margin.
- Cut (low, low): little sold and little earned.
The ranked reprice list. No AI, one formula over every candidate below target.
- Target price = unit cost / (1 minus target), rounded up to the cent. At 40% that is cost / 0.6.
- Monthly impact = (new unit margin minus current unit margin) times units sold in the period, the dollars a month repricing to target recovers.
- Rise percent is how steep that is off today's price.
Most candidates take the reprice branch and show that impact. A candidate below the floor that needs a steep rise (over 25%) and sells only a little takes retire or decide: you cannot reach target without a volume-killing jump, so the options are a small rise or retirement, and the figure shown is the margin currently at risk, not an amount recovered. The list ranks by that figure and shows the top three; the rest folds into Needs attention. Repricing happens in Shopify through the deep link; Atlessa suggests, Shopify sets.
The margin bridge. It answers why your blended margin rate moved from the prior period, splitting the whole move into three mutually exclusive, collectively exhaustive buckets:
- Cost: your WAC input costs moved.
- Price: your sale prices moved.
- Mix: you sold a different blend, more high-margin or fewer thin ones, catalog arrivals and departures included.
The walk applies one lever at a time, cost then price then mix, so the differences telescope to the exact total with nothing left over. There is no volume bucket by design: a rate is normalised by revenue, so unit counts move margin dollars but not the rate, and only the blend (mix) can. Being a comparison, it stays blank until a second period exists.
Rounding. Money is held as exact integer cents and margins as basis points, so totals add up cleanly; percentages and currency are formatted only at the last step, at the view edge.
Common questions
- Why does a product show no margin or quadrant?
- It has no fulfilled, unrefunded sales in the selected period. The table never hides your catalog, so every product is in it (see All), but the margin percent, quadrant, and repricing recommendation all need sales in the period, so a zero-sale row shows none. If it is also unpriced it shows a Set a price hint. Widen the period and the figures fill in.
If it is not working
- My margin looks low.
- Open Do this. It names the biggest-impact laggards, ranked by dollars per month recovered, with a suggested price on each. Work down from the top and reprice in Shopify through the deep link; the banner totals what fixing the listed products is worth per month.
- The Margin bridge is empty.
- It needs a prior period to compare against. On a first period there is nothing to measure the change against, so it stays blank and fills in once you have a second period.